Week 11: Further Development
This week we continued development mainly on the frontend of the platform.
Development: Manage Questions Page
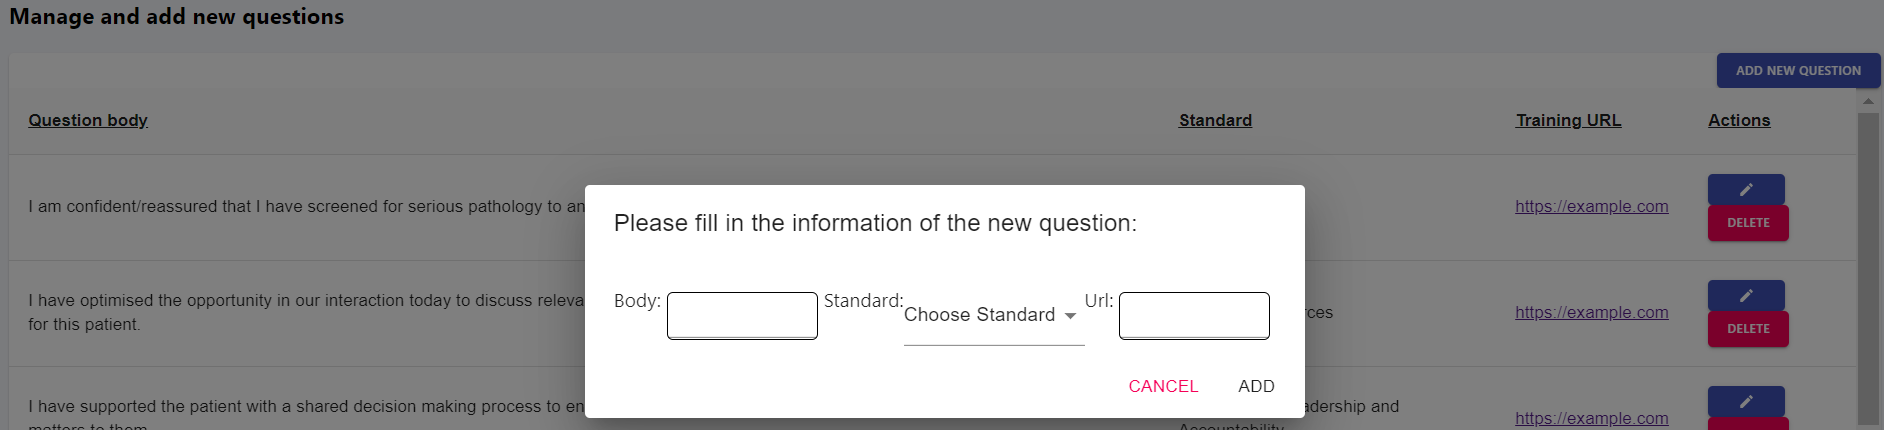
This week we fully completed the implementation and wiring of our Manage Questions admin page. This page was fairly similar to the Manage URLs page however required additional functionality and some crucial tweaks.
The first main difference was that for each question (i.e. row) when the edit button was pressed all the columns should be editable, not only the URL.
To do this we used the <Input/> component like the URLs however for the standards we needed something different because the user should only be able to select standards from a pre-defined set; a Material-UI component that fitted this case perfectly was <Select/>, to add a dropdown menu to select the standard from.
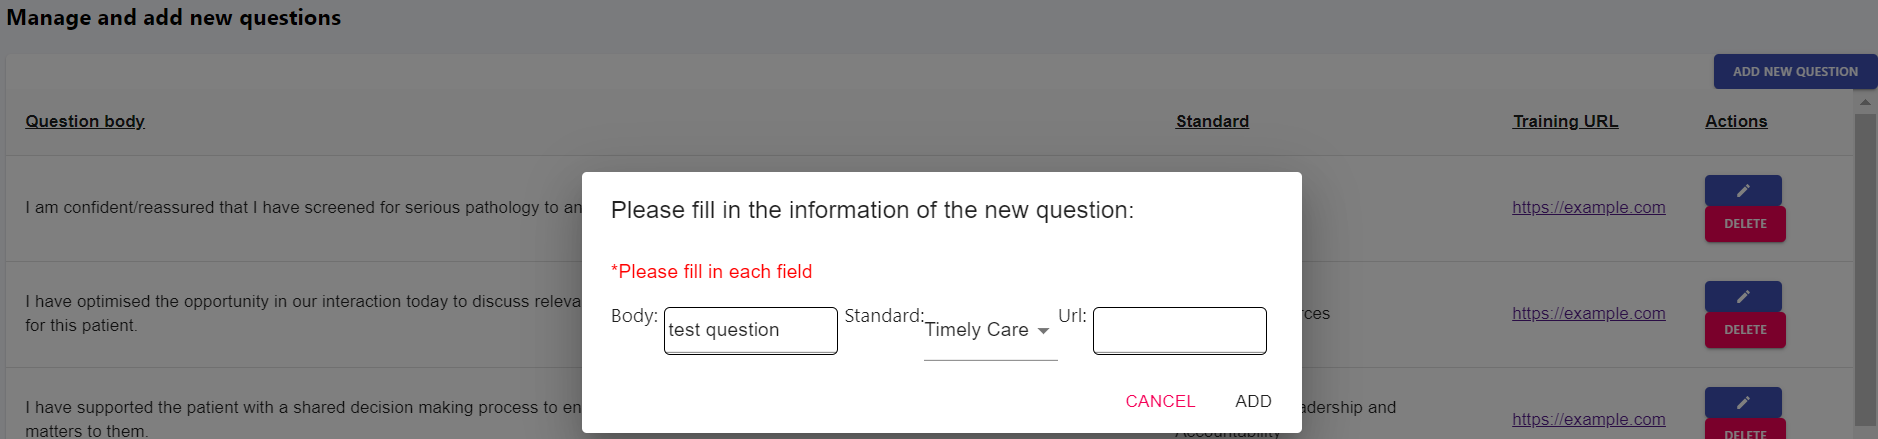
We then added some validation logic similar to the self-assessment page so that a user cannot accidentally create a question with empty fields:
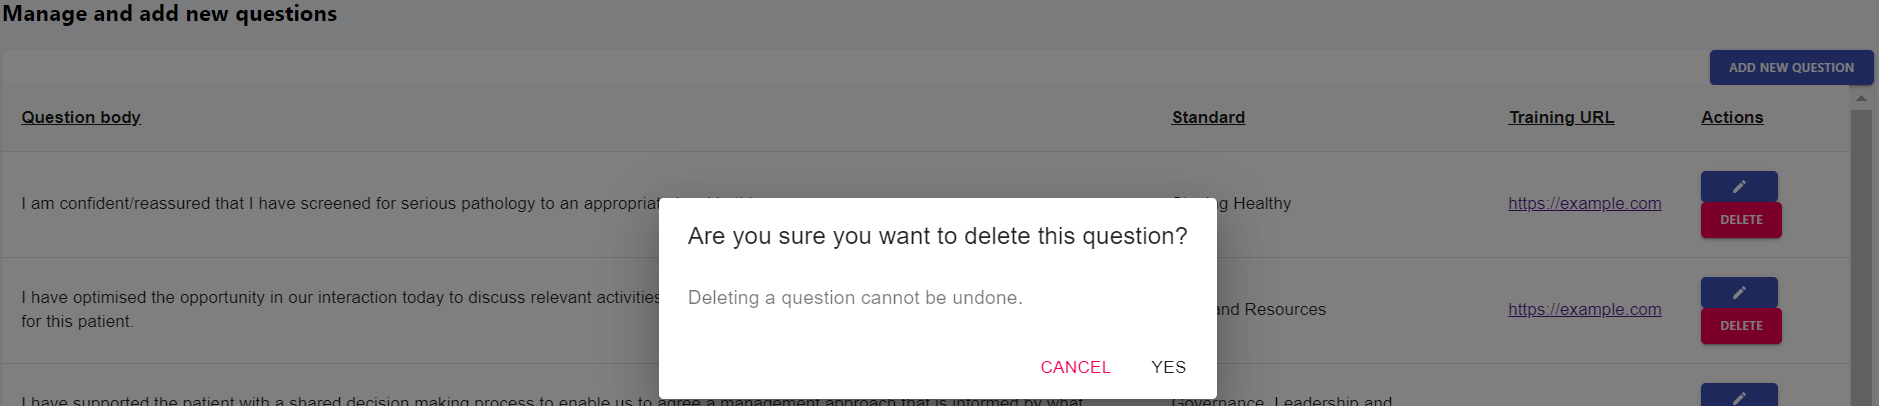
Then next step required us to deal with how the delete button in the table will work, we decided that having a separate delete button for each question will be beneficial for the users and having a pop-up to to prompt the user will be a nice safety feature against user mistakes; we implemented this using our <AlertDialog/> component also used in the self-assessment page:
Having the UI side done all that was left to do was connecting it to the backend:
- The questions are fetched using the
GET /api/questions?default_urls=1API endpoint. Thedefault_urlsquery parameter is used to override the default behaviour (where department-specific URLs are returned if they exist) and instead only ever gets the default URLs. - The save button has been wired up to the
PUT /api/questions/[questionId]API endpoint to save the updated questions fields to the database. - The add button has been wired up to the
POST /api/questions/API endpoint to save the new questions fields to the database. - The delete button has been wired up to the
DELETE /api/questions/[questionId]API endpoint to delete the respective question in the database.
We also used the same philosophy of re-fetch (revalidate cache) mechanism as manage URLs, to make sure the table is in sync with potential changes made by others at the same time.
We also made some tweaks to the backend and API to support these functionalities, for example adding a DELETE /api/questions/[questionId] endpoint to facilitate deleting questions from the UI. As we have done up till now, these were also implemented using Next.js API routes and Prisma to interact with our database.
Development: Statistics Page
We continued work on the statistics page this week. Most importantly, we began to connect the frontend to the backend so we can e.g. view responses from the database on the graph, and use the filters to change the displayed data.
This involved several major changes to the existing implementation:
-
Refactor and fix the state management in the Statistics page
Previously, we had not fully implemented the state management, e.g. storing the state of the visualisation filter, or datepicker, so we weren’t able to use these selections in our code
-
Consolidating components
To make it simpler to propagate the state up from child components, we moved the filters to a single
Filterscomponent. This was done because the Filters on their own would not be used, so the abstraction we previously had proved to be more complex than simply connecting the filters together in a single component. -
Seeding the database with fake responses
To test this, we created a
seedResponses.jssimple Node.js script that uses Prisma to seed data manually into the database for the provided user ID. This means we can now easily add response records to our database and play around with them as we develop, and makes it easier for the entire team to update their database without having to add records manually -
Update the logic for rendering Line Charts
As mentioned in an earlier blog post, we are using Chart.js to implement our line graphs. This library requires a very specific format/data structure to render charts, so we had to create a method to format our data from the database into the format required by Chart.js
-
Backend API improvements
Whilst integrating the frontend with the backend, we noticed gaps in our existing API endpoints, for example needing to return the scores along with their corresponding standard names, rather than just the standard ID, and making sure the data returned was appropriate for the user’s access rights (i.e. clinicians should only be able to fetch their own data; departments should also be able to access their department’s data but not hospital’s, etc.).
We also needed to add support for e.g. ‘is mentoring session’ filters, so the user can filter responses based on whether they are a mentoring session or not.
After this week’s work, our Statistics page now looks like this:
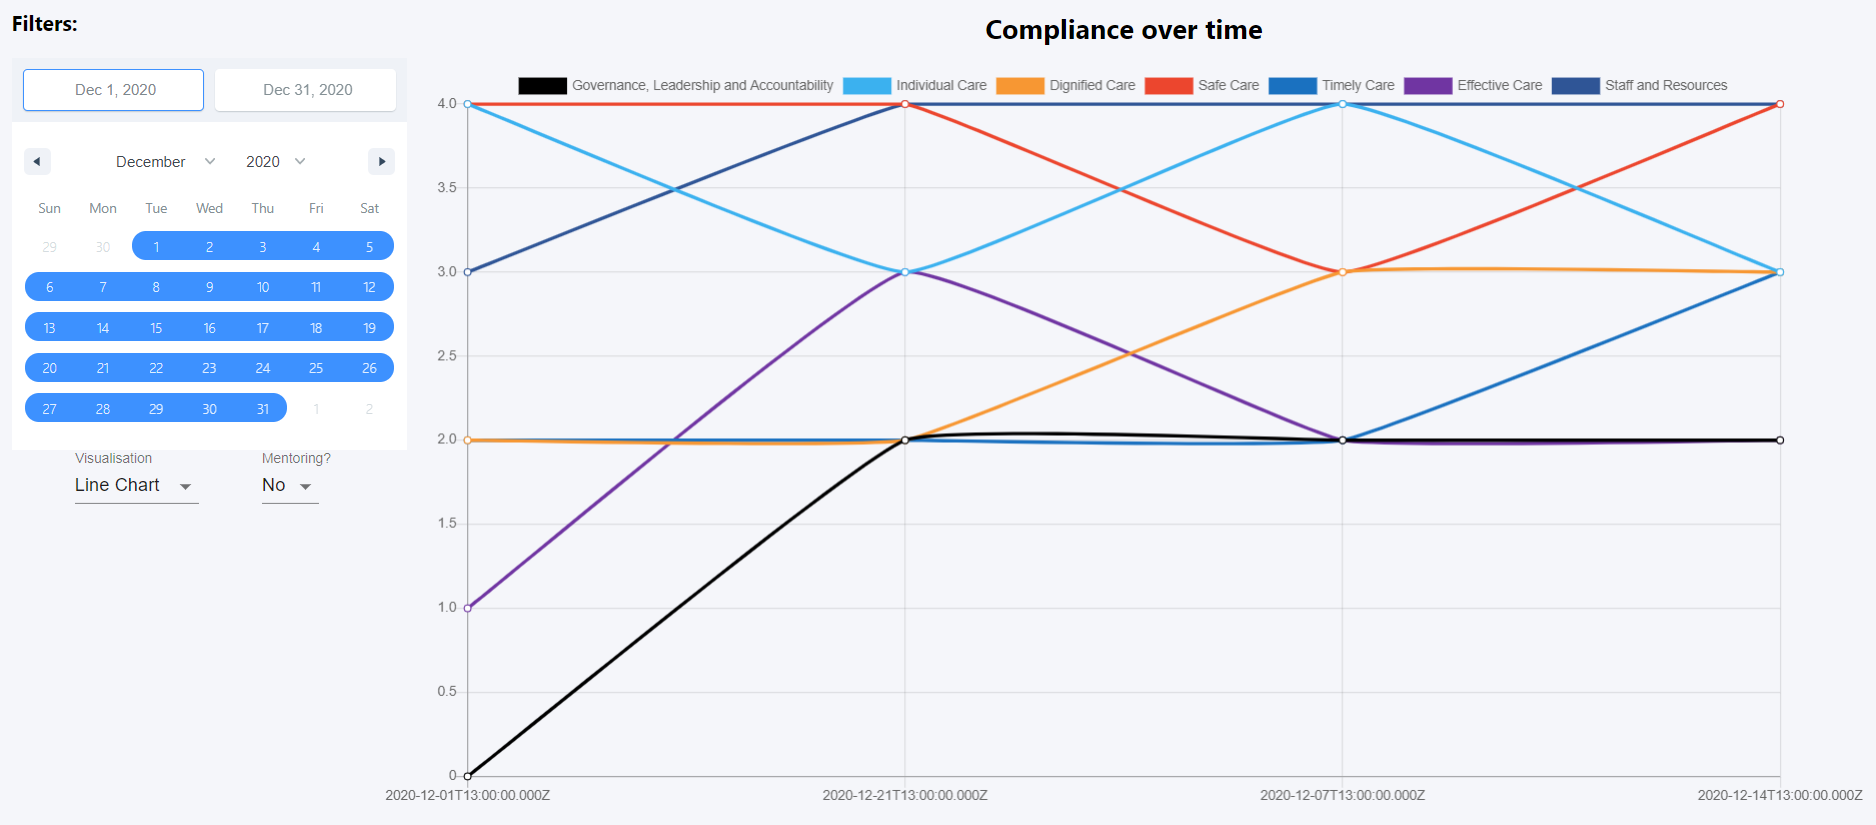
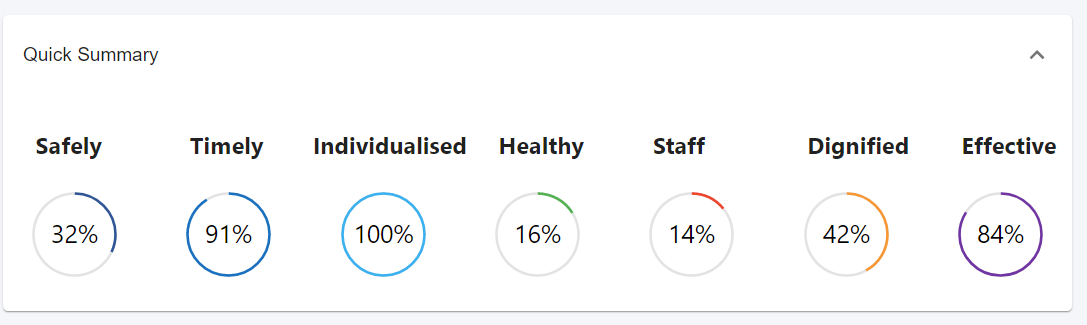
We also made some design tweaks, and improved the design of our average to-date compliance ‘circles’ at the top of the Statistics page.
Previously, we were using Chart.js’ Doughnut chart to display the circles, however this has limitations such as not being able to display text in the middle natively.
After attempting unsuccessfully to add text to the middle of the component, we decided to implement this manually. Our approach is now to use SVGs, which we learnt how to implement from this blog post. Our UI now looks like this:
Next steps
After last week’s user onboarding backend work, this week we hope to work on the frontend areas relating to this, such as displaying the join URL to department managers and hospitals so they can share it, and allowing hospitals to create departments and manage their join codes.
We also hope to continue to work on the Statistics page, and implement the Word Cloud component.
Early next week we also have our meeting with Digital Health Ecosystem Wales, after being postponed from December. We hope to learn more about the NHS official login system in this meeting and investigate our potential use of it.